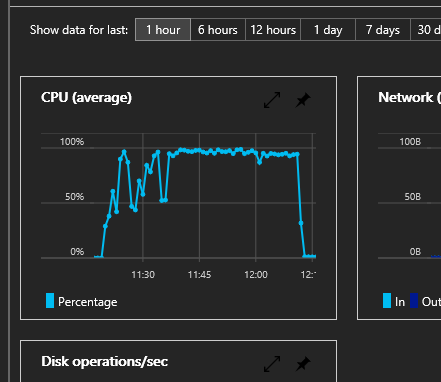
You probably have seen a CPU chart like this one on your Azure VM and wondered what’s going on inside it. Configuring Alert rules in the portal will give you the possibility of being notified if a VM is using more than N % of CPU for longer time than T. When this happens, you can always remote into the desktop via RDP and lurk around trying to see what is going on, but in doing so you will cause effect on the CPU’s prioritization and modify what is happening. Also, you might be too late and the CPU spike may already be over.
In order to monitor Windows based VMs in Azure, I’ve had a little Powershell script for years now that runs Performance Monitor for a while every time the machine boots to sample what the processor is doing.
The Powershell Script
The script is only a few lines long and accepts the sampeling internal, max number of samples and path to archive the sample to once it is done.
Param(
   [Parameter(Mandatory=$False)][int]$SampleInterval = 5,
   [Parameter(Mandatory=$False)][int]$MaxSamples = 100,
   [Parameter(Mandatory=$False)][string]$ArchivePath = "...fileshare path..."
)
mkdir c:\tools
$outfile="c:\tools\run-perfmon.ps1"

$buf = @"
`$CtrList = @( "\Process(*)\% Processor Time" )
`$perflogfile = "perflog_`$(`$env:computername)_`$(Get-Date -format 'yyyyMMdd_HHmmss').csv"
`$perflogpath = "`$(`$env:temp)\`$perflogfile"
Get-Counter -Counter `$CtrList -SampleInterval $SampleInterval -MaxSamples $MaxSamples | Export-Counter -Path `$perflogpath -FileFormat CSV -Force
Copy-Item `$perflogpath $ArchivePath
"@

write-output $buf > $outfile

schtasks /CREATE /TN "Perfmon onboot" /SC ONSTART /RL HIGHEST /S $env:computername /RU SYSTEM /TR "powershell -ExecutionPolicy Unrestricted -File $outfile" /F
The script creates a new powershell file called run-perfmon.ps1 in the C:\tools directory and then creates a Scheduled Task running as SYSTEM that runs the script everytime the machine starts.
I only sample the perfmon counter of the CPU time of all running processes (\Process(*)\% Processor Time), but you could add more if you like. The powershell cmdlets Get-Counter collects the counters and the cmdlet Export-Counter saves it as a CSV file. After the sampling has ended the CSV file is copied to the archive path passed as an argument.
The default sample interval and max samples is set to 5 and 100, meaning we will get a sample once every 5 second 100 times, which is 500 seconds or 8 minutes. If you want to keep sampling for 30 minutes you need 30 * 60 / 5 = 360 samples.
Installing the Script
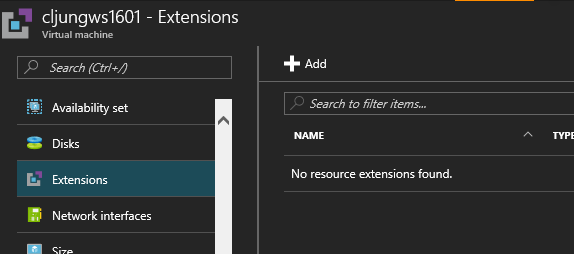
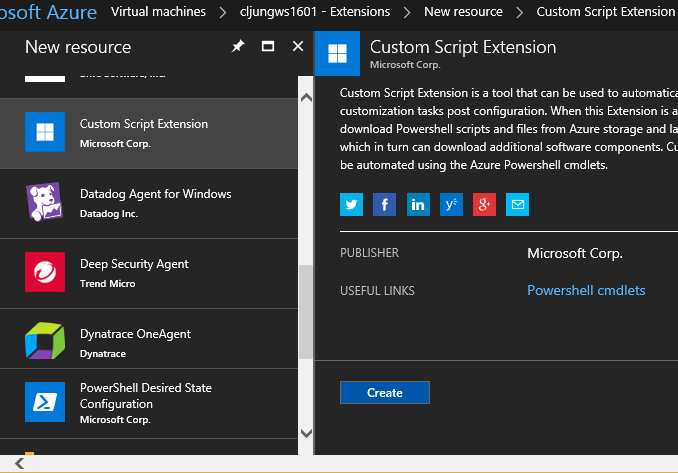
Installing the script so it runs on every boot is done via adding the Custom Script Extension to you VM and having it run the script
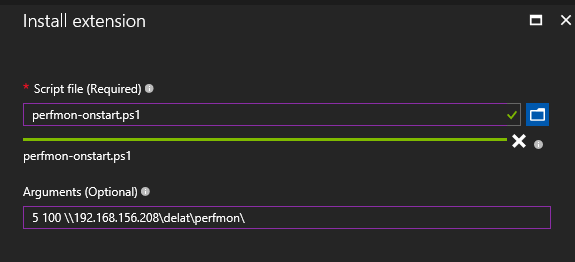
Click on the blue folder image, browse to the file on your local machine (or use a url to a public source, like github https://raw.githubusercontent.com/cljung/azps/master/perfmon-onstart.ps1). Finally, add the arguments of the sampling rate you want and where you want to pick up the CSV file.
After it is installed it will run perfmon each time the machine restarts.
Checking the output
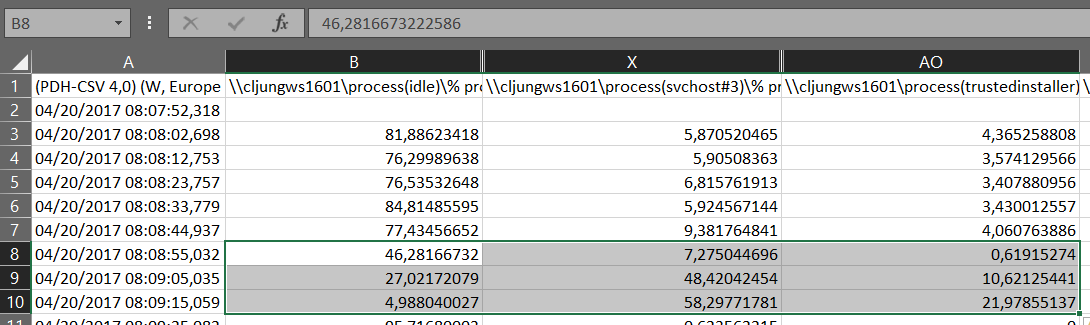
The output format in my example is a CSV file, so I use excel to open it. The first process column is the Windows Idle process and seeing values like 46%, 27% and 5% tells you the processor is doing something. Scrolling a bit to the right reveals that a background service together with the TrustedInstaller is taking up the majority of the CPU.
This tells me that the VM is actually working hard due to Windows Update and that the CPU spikes I saw are temporary and will go over. If it had been any other processes working hard, I might had started to try to understand if it was due to the VM being sized to small.
Summary
In a real production environment you probably have OMS, System Center or some other monitoring solution checking the health of your servers. The Azure portal in itself gives you some monitoring capabilities, but once you see that the machine is working hard you need an easy way to understand why. This script is an easily way to get insights on what processes are running in the VM that are bogging down your machine. I used task scheduler to run this script at boot time, but you can easily change to have it being run on anything that the task scheduler supports.
References
Powershell script on github
https://github.com/cljung/azps/blob/master/perfmon-onstart.ps1