Achieving high availability with Azure AppServices that is datacenter resilient usually means you need to deploy your WebApp twice in to different Azure Regions (datacenters) and put Azure Traffic Manager infront of it. But just load balancing your app between two datacenters doesn’t solve your problem, because you need to handle the failover between the two sites. Failover becomes complex for state and persistent storage, like databases. This blob post is aimed towards giving you ideas on how you can handle this failover management. It will be a bit lengthy, but I want to cover the complete scenario and I hope that reading it will be rewarding.
Deployment architecture
To set the stage, the architecture is as depicted in the figure below. It’s a simple WebApp deployed to the Azure Regions North Europe and West Europe. The WebApp uses SQL Azure as a backend database and the databases are geo-replicated so that the db in North Europe is the primary allowing read/Write and the db in West Europe is just Readable.

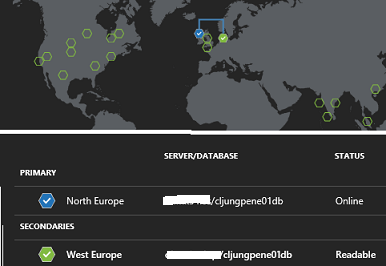
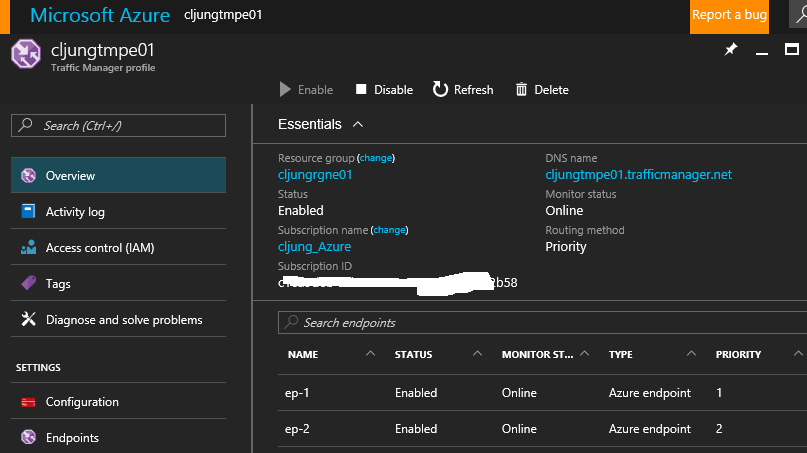
Traffic Manager is set up to point to the two WebApp endpoints and with routing in Priority mode. This means that all traffic will be routed to the endpoint with the lowest priority as long as it is available. This makes North Europe our primary site and West Europe a backup site which will make the solution resilient towards a datacenter failure.
Traffic Manager Probing
How does Traffic Manager know when to fail over? TM probes each endpoint to see that it’s still there and as long as it returns an HTTP 200 status TM will keep the endpoint. You can configure what url should be used for probing. The default value for Path is “/” which means the default page, but as you will see later, this is not an optimal choice. You want a page that returns the response as fast as possible and still does the necessary checks of its health. I have a special webpage, probe.aspx, that handles the probe requests. I have also set a very low DNS TTL which means that TM will give the answer to which endpoint should be used with a very short time span. This is good in testing environment for validating the failover. In production you would have a higher value.

The probing process is described in the documentation https://docs.microsoft.com/en-us/azure/traffic-manager/traffic-manager-monitoring and I really encourage you to read it now before you move on in this blog post. There is one thing that the documentation doesn’t mention and that is that you will be probed by multiple callers, as you will see below, which means there will be a whole lot more hitting your probe webpage. This is why you don’t want to use the default page as probe Path.

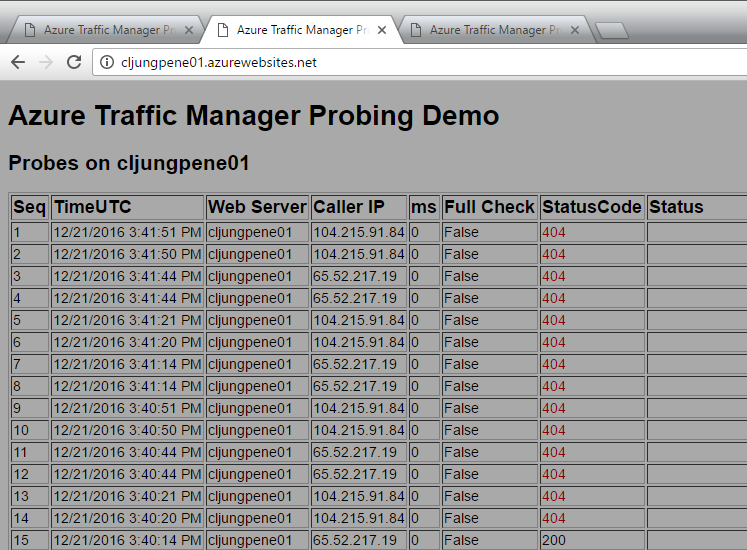
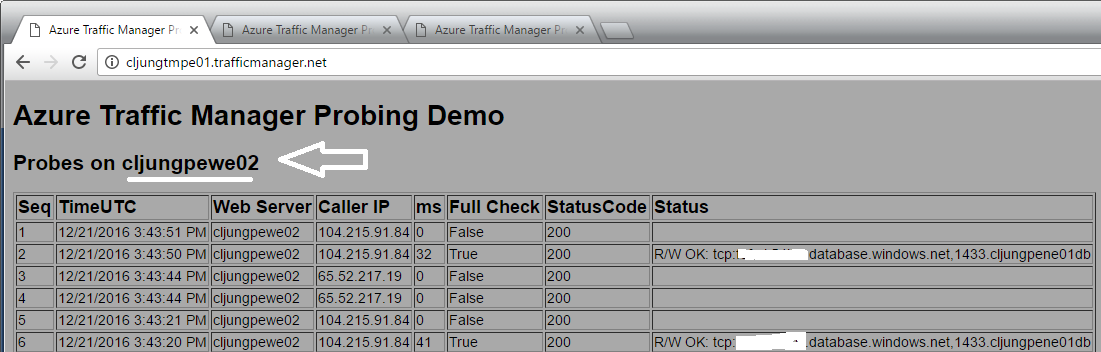
In the above screenshot my WebApp is being probed by ip address 104.215.91.84 at seconds 20, 21, 50, 51 at a steady beat and by 65.52.217.19 at seconds 14, 14, 44, 44. This is 8 times a minute, which is quite alot. The pattern here is that it is probed 30 seconds apart, like 20-50, 21-51 and 14-44. You also can see the funny fact that by accident we happen to have to probes exactly using 14-44.
Since we are being probed 8 times a second, I’ve implemented my probing logic in the code to do a database check not every time but just every 30 seconds, as can be seen in the Status column. The rest of the times we cache the db status and assume it hasn’t change since we don’t want to hit the db too much.
But, the important thing is that the probe page actually returns HTTP Status 200 if the database is read-writeable (code does a dummy update in a table) which means we should be good.
Simulate a failure
I’ve created this WebApp so that I can start returning HTTP Status 404 to the TM prober. If I pass query string statusCode=404 the probe logic will save that and return it until I tell it to start returning 200 again.
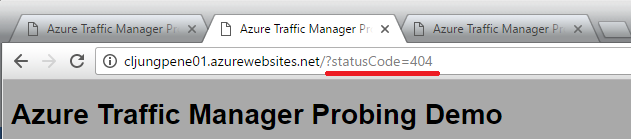
Once the probe page is set to return 404, you can see it starting to return 404 errors.
What happens now is explained in the documentation:
“The monitoring system performs a GET request, but does not receive a response within the timeout period of 10 seconds (alternatively, a non-200 response may be received). It then tries three more times, at 30-second intervals. If one of the tries is successful, then the number of tries is reset.”
This means that it takes 4×30 seconds before Traffic Manager decides that the endpoint is not online anymore. We can see this by running a PowerShell script in a loop asking for the TM endpoints status. We have 4 calls where both endpoints have status “Online” and on the 5th call it has changed status to “Degraded”.
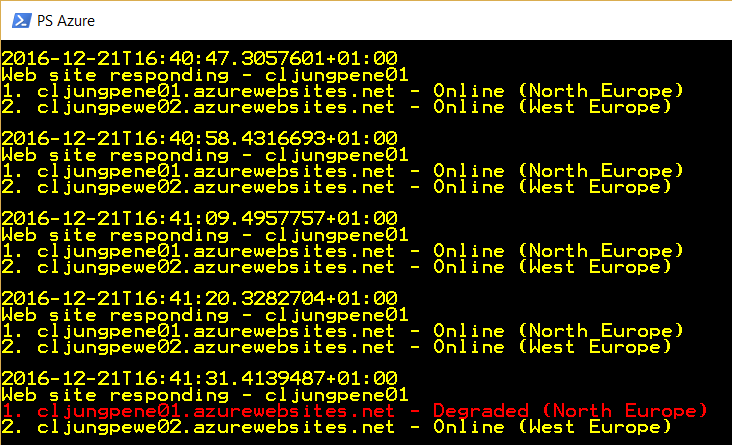
What happens then is that all subsequent requests Traffic Manager gets to resolve which endpoint to use will go to the WebApp in West Europe.
Current browser sessions to the faulting WebApp in North Europe have to time out and there is no redirection from North to West. Traffic Manager is basically a DNS extension to the Azure DNS and when you resolve the name xxxxx.trafficmanager.net, it will return the ip address of the endpoints it has according to priority and status. This means that local DNS caches will play a trick on you as it will resolve the xxxxx.trafficmanager.net name to the ip adress of the faulting WebApp until the DNS cache times out. You can see this behaviour in the last call in the PowerShell screenshot where the WebApp responding is still the one that failed (remember – I just simulate a 404 to the prober. The WebApp is still ok).
Strategies for handeling failover
OK, now you’ve seen the TM failover in action and understand how it works, but how should you implement your solution to handle it? My advice is to keep calm and not overreact and start a full failover, since the issue your WebApp is having might be a short glitch. If you implement a monitor like my short PowerShell script to watch the status of the TM endpoints and fire an alarm if anyone becomes “Degraded”, chances are that by the time an operator sees this event it has selfhealed, meaning the TM endpoint is “Online” again.
Param(
   [Parameter(Mandatory=$False)][string]$TrafficManagerName = "",            # TM name
   [Parameter(Mandatory=$False)][string]$ResourceGroupName = "",             # Azure Resource Goup
   [Parameter(Mandatory=$False)][int]$Sleep = 10                             # Sleep time in seconds between monitor calls
)

Do
{
    $html = Invoke-WebRequest "http://$TrafficManagerName.trafficmanager.net/whoareyou.aspx" -Headers @{"Cache-Control"="no-cache"}
    write-output "$(get-date -format 'o')"
    write-output "Web site responding - $($html.Headers["WebSiteName"])"

    $ep = Get-AzureRmTrafficManagerProfile -Name $TrafficManagerName -resourceGroupName $ResourceGroupName
    foreach( $endpoint in $ep.Endpoints) {
      if ( $endpoint.EndpointMonitorStatus -ne "Online") {
        write-host "$($endpoint.Priority). $($endpoint.Target) - $($endpoint.EndpointMonitorStatus) ($($endpoint.Location))" -ForegroundColor Red
      } else {
        write-host "$($endpoint.Priority). $($endpoint.Target) - $($endpoint.EndpointMonitorStatus) ($($endpoint.Location))"
      }
    }
    write-output ""
    Sleep $Sleep
} while(1 -eq 1)
Strategy 1 – survive the short glitch
To survive the short glitch you have two options. If your WebApp can live with a read-only database, the WebApp in West Europe can serve content from the West Europe database. You have to have some logic in your WebApp to know if it runs in a read-write or read-only, because the SQL ConnectString needs to include “ApplicationIntent=readonly;”.
If your app is not built for read-only mode, you have a second option and that is for the WebApp in West Europe (secondary region) to do connect to the database in North Europe (primary region) and cross-region database calls. This is not optimal from a performance aspect, but if the database is working in the primary region, this will make your WebApp have full functionlity during the short glitch. In the case of an outage you will not go from bad to worse so to speak.
Strategy 2 – survive a longer outage
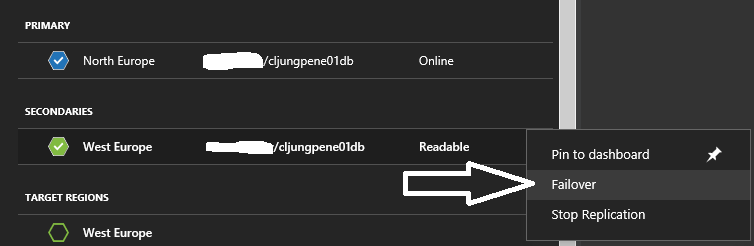
Once you have identified that you have a glitch, and that the described solution above has kicked in, the clock has started to tick for doing a database failover. You need to make your own policy for how long you can live with that configuration. It is probably a human decision involved, but when you decide to fail over, you do two things: Fail over the database and reconfigure the connection strings in the WebbApps so that they switch roles.
Since you basically now have swapped the Primary and Secondary regions, you might consider changing the Priority of the Traffic Manager’s endpoints. Otherwise it will start to resolve the name to the North Europe WebApp as soon as it comes back online, which means you will be back to cross-region database calls again. The clock has now started ticking for making the decision on when its time to do the failback.
Summary
My primary objective in this post was to show you how Traffic Manager probing and failover works, how you can implement a probe webpage logic and how you can monitor the status of the TM endpoints. My secondary objective was to give you ideas on how to handle failover situations, since these situations are often associated with heated discussions and even perhaps are subject to scrutiny if your service have fullfilled its SLA and if your end-customer have the right to any kind of reimbursement. To minimise heated discussions and economical damage, you need to handle the failover as smooth as possible. This is what I mean with – keep calm, don’t overreact.
References
Documentation – Traffic Manager Endpoint Monitoring and Failover
https://docs.microsoft.com/en-us/azure/traffic-manager/traffic-manager-monitoring
Documentation – Traffic Manager Overview
https://docs.microsoft.com/en-us/azure/traffic-manager/traffic-manager-overview
Sample WebApp sources
https://github.com/cljung/AzTmFailover