Azure Storage is one of the key core infrastructure components that basically all other Azure features rely upon. It is very easy to use since you just create a Storage Account and off you go, but to know how it actually performs, you must switch on what is called monitoring and logging. However, like all monitoring data, you must know what to look for in order to get some value out of it.
Storage Monitoring and Logging basics
Storage Monitoring and Logging are built in features in Azure Storage and has been since day 1. You only need to turn them on.
Monitoring is about recording data about capacity and metrics. Capacity is info about the used space in the account, the number containers (root folders) and objects (files). It is only recorded with a frequence of once a day. This is the data you need to track storage growth.
Metrics is a whole lot of information about how your Storage Account is performing such as availability, average response time, total ingress, total egress, network and throttling errors. The metrics data is recorded in two major different buckets where one is per hour and the other per minute. If you are doing deep perf monitoring you would use the per minute. I will only use the per hour data which means that a value such as average response time is the average per hour. One bad response time during that hour raises the average significantly if we have a low amount of requests.
Both Capacity and the different Metrics buckets are recorded to Azure Table Storage, where capacity is recorded to a table named $MetricsCapacityBlob and the hourly metrics for blob transactions are stored in a table named $MetricsHourPrimaryTransactionsBlob. Replace Hour for Minute and Blob for Table/Queue and you’ll have the complete palette of what’s being recorded. There are some very good, but quite heavy, articles in the Azure documentation explaining this (see refs below).
Logging is a different thing and is capturing the storage requests being sent to your account. It is compareable to the IIS-log of a webserver logging requests from clients. This data is perfect for analyzing what’s going on on an application level. It is stored in a special container named $logs with the storage account itself. Under the $logs container and in there you will find blobs named blob/2015/11/06/2000/000001.log or table/2015/11/07/1200/000000.log which holds requests for a specific date and hour. The file has sequence numbers to avoid having too large logfiles for a single hour.
Rule of thumb – If you just want to know how your Storage Account is performing, then you should enable Monitoring. If you also need to know about the requests applications are sending, then you should also enable Logging.
Turning on Monitoring and Logging is easy, getting the data being recorded and understanding it is the harder part and that is what I will try to show you.
Retrieving Capacity data
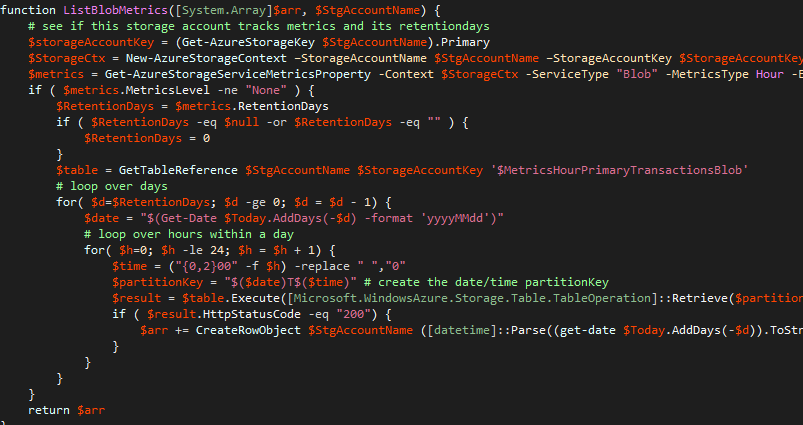
Given that we have enabled monitoring, how do we retrieve the data from the Azure Table $MetricsCapacityBlob in a powershell script?
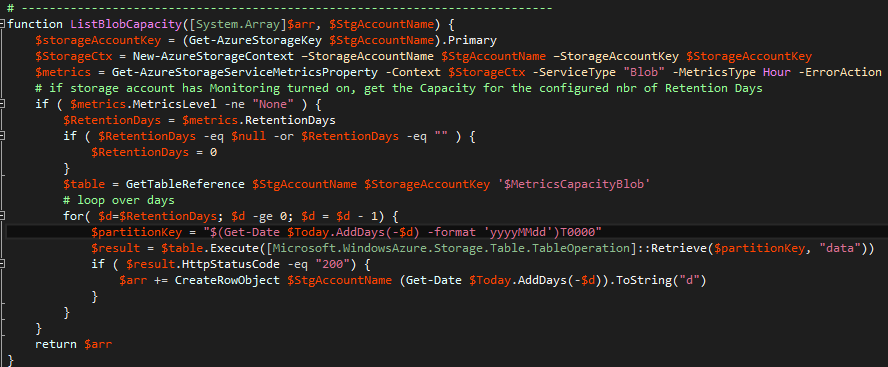
The function above gets the storage key and then calls Get-AzureStorageServiceMetricsProperty to get the Monitoring config for Blobs and the Hour bucket. If RetentionDays isn’t specified we are using 0 which means that we only store it for the current date. Then it gets a reference to the $MetricsCapacityBlob and loop over the number of retention days and reads the data for each day. The PartitionKey for the $MetricsCapacityBlob is in format YYYYMMDDT0000. If the HTTP response is OK, then we grab the data and add it to an array of data.
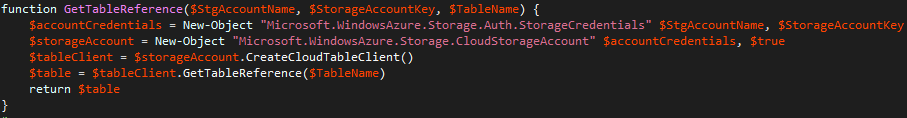
There is no native support for reading an Azure Table in powershell but it is possible by creating the objects via New-Object and using the CreateCloudTableClient and GetTableReference methods.
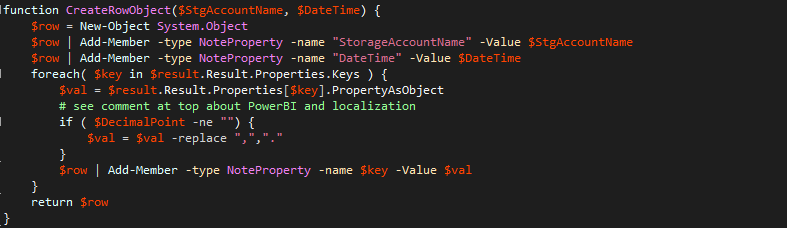
The data retrived from the Retrieve operation on the Azure Table is a TableEntity and we can enumerate all properties in a key/value pair fashion to create an internalpowershell object (which we need later to save it as a CSV file). The DecimalPoint clutter is due to the fact that although the Locale in my country and on my computers has the comma (“,”) as the decimal point, PowerBI doesn’t understand that (yet). If I am to use the output in Excel, I must have a comma as separator in the CSV file (since that is my Windows setting). But if I want to import the CSV file to PowerBI (which is all nicely localized in my local country in the UI), it will assume that decimal point is period (“.”) and comma is a thousend separator. If the CSV file has a value of 27,983 as AverageServerLatency then that is interpreted by PowerBI as 27983 seconds instead of a little less than 28 seconds. When PowerBI understands different Locale, this can be removed.
Downloading Capacity data to a CSV file
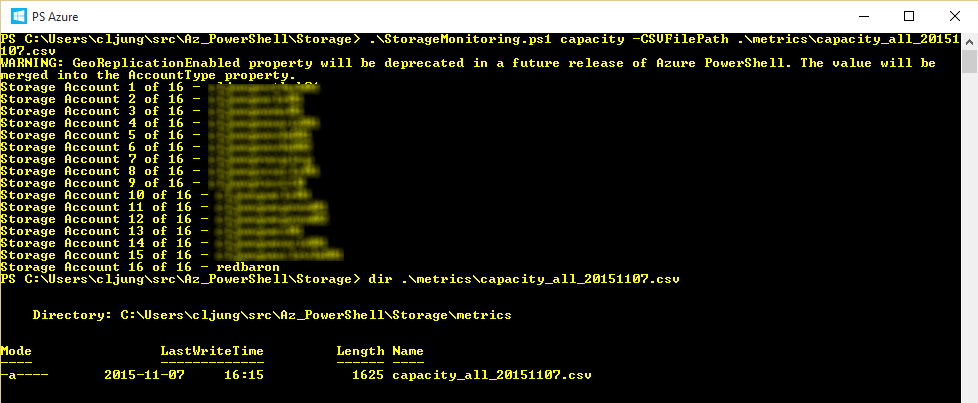
The whole point of automation is reducing and eliminating tedious manual steps, and what you probably want is a way to retrieve Capacity data for all your Storage Accounts in one go. The powershell script enumerates all Storage Accounts and invokes the ListBlobCapacity function, described above, and all the capcity data is stored in the array and written out as a CSV file together.
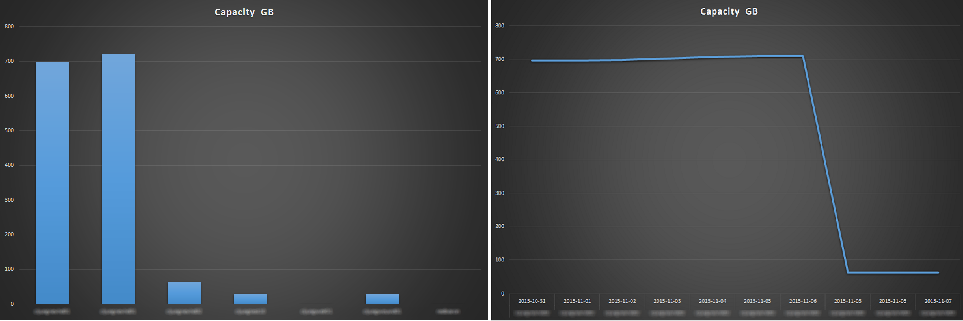
Importing the CSV file with Capacity data, you can chart it like below in Excel and get an overview of your storage usage. To the left I used a bar chart showing how much storage each account is using and to the right it’s a line chart for a single account that have reduced its stored data during the measured period.
Retrieving Metrics data
Getting the Metrics data follows the exact same pattern as getting the Capacity data from a powershell script perspective. The only difference is that it’s another Azure Table we are retrieving the data from and that the data i sampled per hour. Therefor, there is an outer for-loop for days and inner for-loop for the hours, but the rest is exactly the same.
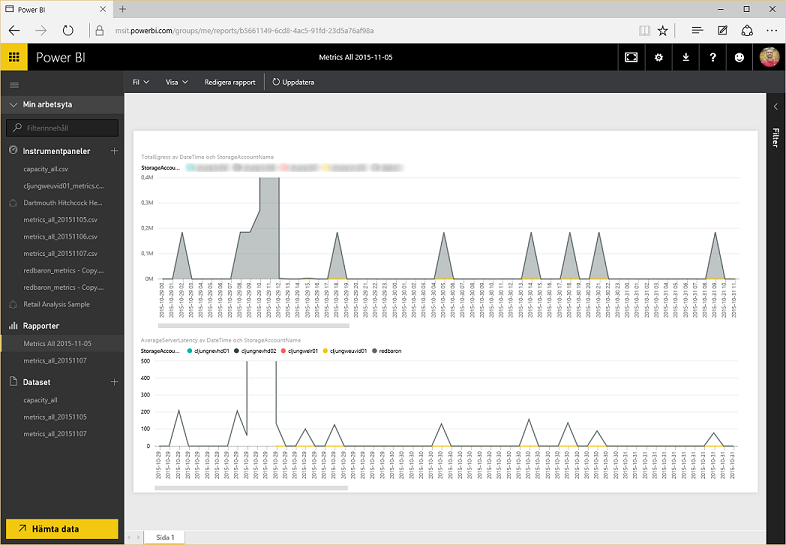
Running the script and creating a CSV file with metrics for all Storage Accounts and then uploading it to PowerBI, gives you the ability to create some interesting diagrams. Below the top diagram shows the TotalEgress for storage accounts and the bottom show AverageServerLatency over time. As you can see there are several spikes in TotalEgress, which means data is being read from storage, and each spike is accompanied by the AverageServerLatency increasing in a similar fashion.
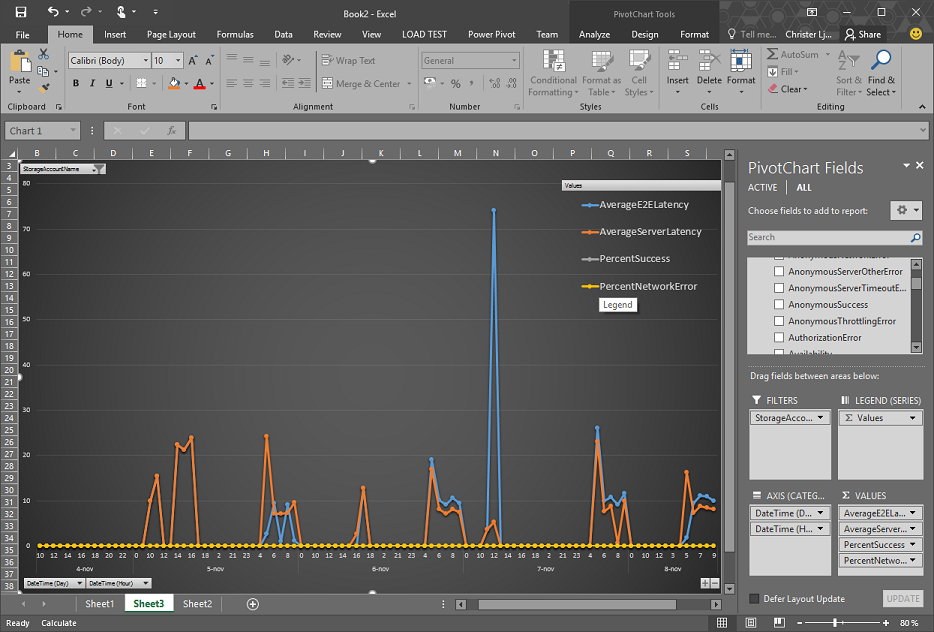
Loading the metrics CSV file into Excel and using PowerPivot to analyse it, you can create a chart like below easily showing the performance of a storage account. In this chart DateTime is used as Axis, StorageAccountName as Filter and AverageE2ELatency, AverageServerLatency, PercentSuccess and PercentNetworkError as Values.
8 functions of my Powershell script
The powershell script being used in this post have 8 functions, which are
- List Storage Account(s) Capacity
- List Storage Account(s) Metrics
- Show current Monitoring config
- Set Monitoring config
- Show current Logging config
- Set Logging config
- List available log files
- Download available log files
The first two are what I’ve used in the post. The Show/Set functions will help you manage the settings across accounts so that you can see and change them with one command. The Download function would be the next step in analyzing futher what actually caused those spikes in the PowerBI diagrams above.
Summary
Storage Monitoring and Logging has been available in Azure for a long time and I am certainly not the first one to write about it. But this post tries to get you from theory to practice with as little as a single powershell script. There are of course other and more competent tools to handle this, but the point is that you should start getting familiar with how to use this data in order to avoid running out of storage or having performance issues coming as a surprise to you. It is really as easy as enabling monitoring and logging and then start downloading and analysing the data.
References
Documentation – Enabeling monitoring and logging via Powershell
https://msdn.microsoft.com/en-us/library/azure/dn782840.aspx
How to monitor a storage account in the portal
https://azure.microsoft.com/en-us/documentation/articles/storage-monitor-storage-account/
Storage Analytics documentation
https://msdn.microsoft.com/en-us/library/azure/hh343270.aspx
Monitor, diagnose, and troubleshoot Microsoft Azure Storage
https://azure.microsoft.com/en-us/documentation/articles/storage-monitoring-diagnosing-troubleshooting/
Metrics data documentation
https://msdn.microsoft.com/en-us/library/azure/dn782843.aspx
Sources
Please read the readme.txt for how to use all the 8 different functions.
http://data.redbaronofazure.com/public/StorageMonitoring.zip